We believe in results, strong relationships, and lasting impact.
Services
Crop Optimization
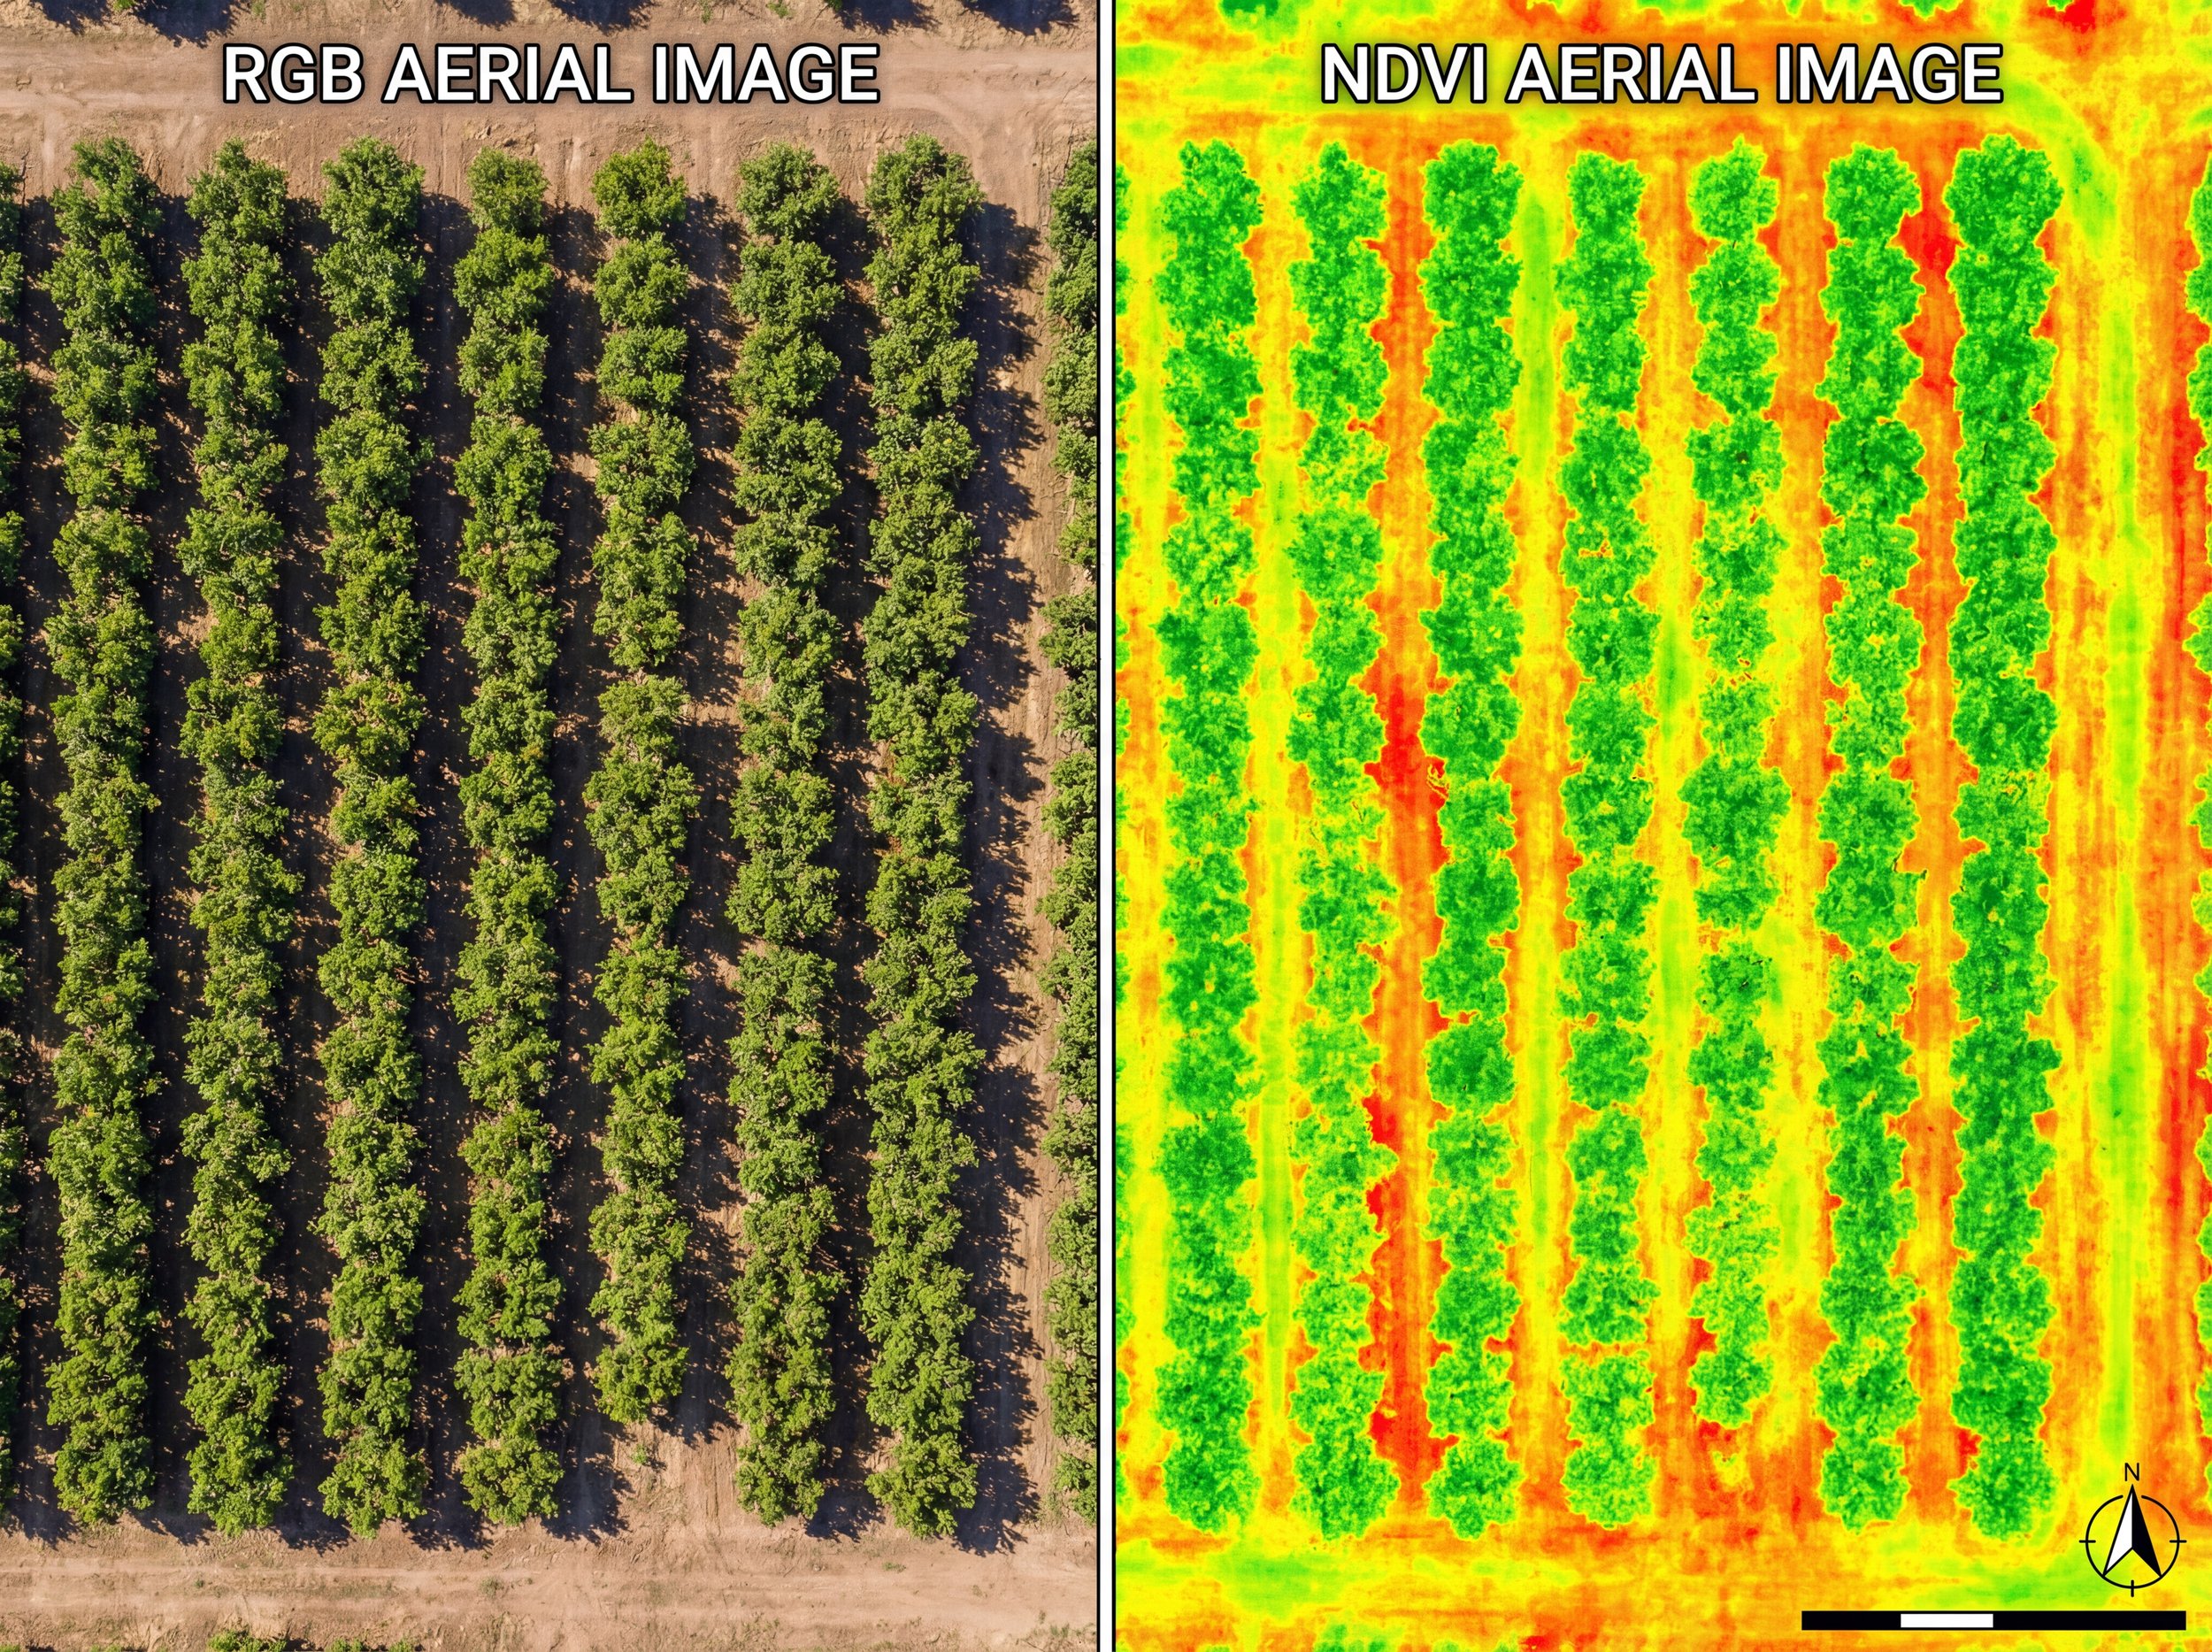
Variable-Rate Zones (NDRE/GNDVI). We convert multispectral imagery into clear management zones—typically three to five classes—so you can target inputs with confidence. The result is a clean, color-coded map backed by acres-per-zone totals and files ready for your farm software or controller.
Stand / Plant Counts (RGB). Early in the season, we map population and emergence to reveal thin areas and gaps before they become costly. You receive a population heatmap, low-stand callouts, and a concise table of counts by field or zone.
Change Detection Report (before/after). When timing matters, we document the impact of an application or field action with pre- and post-flight analysis. A side-by-side view and a delta map summarize where vigor improved, where it declined, and by how much.
Moisture / Leak Mapping (NDMI/NDWI). We flag relative wet/dry anomalies to help you find irrigation leaks, clogs, or waterlogging quickly. Your report highlights priority areas so crews know exactly where to look first.
Prescription Export Pack. When you’re ready to operationalize decisions, we package zones and rate tables in open formats—Shapefile, GeoJSON, and ISO-XML—so your prescriptions load smoothly into supported systems.
Orchard Intelligence
Tree-Level Inventory & Missing-Tree Map. For orchards and groves, we detect individual trees, flag missing or weak points, and deliver a clean inventory with counts by block. It’s a practical ledger for replanting, labor planning, and budgeting.
Canopy Volume & Uniformity. Using surface models and multispectral layers, we show how canopy size and vigor vary across each block. Managers get a simple, visual read on where to focus nutrition, pruning, or irrigation adjustments.
Replant Priority Heatmap. We transform inventory findings into a prioritized, map-based replant plan so you can address the highest-value areas first.
Irrigation Runtime Map. Where supported, we translate zone differences into straightforward runtime guidance—presented as minutes-by-zone—so teams can act without extra interpretation.
Block Scorecard (manager view). Each block receives a one-page summary with the key indicators that matter: uniformity, problem hot-spots, and the next recommended actions.
Sugarcane Programs
Emergence & Gap Map (early setts). We capture early establishment patterns to identify gaps and variability while there’s still time to respond.
Ratoon Health & Stool Density Index. We provide a quick, map-based read on ratoon vigor and stool density indicators to guide follow-up decisions.
Lodging Risk Scan (pre-harvest). Before harvest, we highlight areas with elevated lodging risk so field plans and resources can be adjusted proactively.
Ripener / Zoning Guide. A concise zoning guide supports ripener planning and passes, aligning operations with the spatial variability you see on the map.
Season Monitoring
Season Trend Pack. Over three to four flights, we track how fields evolve and package the results with simple trend charts and a season summary playbook. It’s an easy way to turn periodic flights into a continuous improvement loop.
Before/After Efficacy Check. For targeted spot work, we provide a clear visual confirmation of results over time, making it simple to document impact.
Field Benchmark Scorecard. When you need comparisons at a glance, the scorecard distills each field’s status into a manager-friendly page for reviews and planning.
Field-Ready Tools & Reporting
Scouting Pack. Every project can include geotagged pins with notes and photos so crews navigate straight to the issues and resolve them faster.
GeoPDF Field Map. We deliver phone-friendly, offline maps that display your live GPS position in the field—no special software required.
Shadow / Soil Mask & Smoothing. For the cleanest possible maps, we reduce shadow and soil noise and apply smoothing where appropriate so decision layers are easier to read.
What you receive with every engagement
You get clear, action-oriented summaries and the data to back them up: a one-page PDF for managers, map layers for your records, and open GIS/CSV exports for your agronomy, GIS, or equipment teams. Each deliverable is packaged to be used immediately in the field or in your existing tools—no guesswork, just next steps.
What Sets Us Apart
People-First Approach
Everything we do is built around understanding your needs and helping you succeed—because when you thrive, so do we.
Long-Term Relationships
We’re not just here for the now. We love creating lasting relationships with our clients and growing with them over time.
Proven Process, Flexible Execution
We bring structure where it counts and adaptability where it matters. Our methods are clear, but always responsive.